Understanding Statistics and Numerical Methods in Mathematics Assignments

Statistics and numerical methods occupy a central position in mathematics assignments across science, engineering, economics, and data-driven disciplines. These areas provide systematic tools for describing data, analyzing uncertainty, and approximating mathematical relationships when exact solutions are unavailable. In academic assignments, students are often evaluated not only on calculations but also on their ability to explain underlying principles, interpret outcomes, and justify methodological choices. As a result, many students seek assistance with Numerical Methods assignments to strengthen their theoretical understanding and present well-structured mathematical explanations.
This blog presents a structured theoretical discussion of statistics and numerical methods as they appear in mathematics assignments. It explores how data is measured and organized, how randomness is modeled through probability distributions, how time-based stochastic processes are analyzed, and how numerical interpolation techniques support approximation and estimation. By clarifying these interconnected topics, the discussion also supports students looking for reliable math assignment help, particularly when assignments demand conceptual clarity, logical reasoning, and academically sound explanations rather than purely computational results.

Statistical Structure and Data Classification
Statistical reasoning begins with understanding how data is collected, organized, and interpreted. Before applying any analytical method, it is essential to recognize the nature of the data and the framework within which it can be meaningfully analyzed. This section outlines the foundational ideas related to measurement and data dimensionality.
Scales of Measurement in Statistical Analysis
Scales of measurement define how observations are recorded and what types of comparisons are valid. In theoretical statistics, these scales are essential because they determine which analytical tools can be applied without violating logical assumptions.
Nominal scales categorize observations into distinct groups without implying order. Ordinal scales introduce ranking but do not quantify differences between ranks. Interval scales allow meaningful differences between values but lack a true zero reference point. Ratio scales include both meaningful differences and a natural zero, enabling full comparative analysis. Mathematics assignments often require students to identify measurement scales correctly before interpreting results or selecting statistical techniques.
Univariate, Bivariate, and Multivariate Data Structures
Data can also be classified based on the number of variables involved. Univariate data focuses on a single characteristic and is commonly used for introductory statistical summaries. Bivariate data examines the relationship between two variables, allowing comparison and association analysis. Multivariate data extends this approach to multiple variables, capturing more complex interactions.
From a theoretical perspective, this classification influences how relationships are interpreted and how conclusions are drawn. Assignments frequently emphasize understanding these distinctions to ensure appropriate analytical reasoning rather than mechanical application of formulas.
Statistical Measures and Data Interpretation
Once data is structured and classified, statistical measures are used to summarize and interpret it. These measures condense large datasets into interpretable quantities while preserving essential information about distribution and variability. This section discusses key descriptive measures used in mathematics assignments.
Mean, Variance, and Standard Deviation
The mean represents a central value around which data points are distributed. While often intuitive, its interpretation depends on the overall data structure and the presence of extreme values. Variance measures how widely data points spread around the mean, providing insight into overall variability. Standard deviation refines this idea by expressing dispersion in a scale consistent with the original data.
In theoretical assignments, these measures are used to explain data behavior rather than to perform isolated calculations. Students are expected to understand how variability influences reliability and how dispersion affects comparisons between datasets.
Covariance and Correlation in Data Relationships
When analyzing two variables together, covariance and correlation become essential tools. Covariance indicates whether variables move in the same or opposite directions, offering a preliminary measure of association. Correlation refines this by standardizing the relationship, making it easier to interpret strength and direction.
In mathematics assignments, emphasis is placed on interpretation rather than numerical output. Students must explain what these measures imply about dependency, association, and independence, highlighting their theoretical significance in statistical reasoning.
Probability Distributions in Mathematical Modeling
Probability theory allows mathematicians to describe uncertainty using structured models. Probability distributions provide systematic ways to represent random behavior and predict outcomes under defined assumptions. This section introduces commonly studied distributions in mathematics assignments.
Discrete Probability Distributions
Discrete distributions apply to countable outcomes and are widely used in theoretical probability models. The binomial distribution represents repeated trials with fixed conditions, making it suitable for modeling success–failure scenarios. The hypergeometric distribution differs by considering situations where outcomes are dependent due to sampling without replacement.
The Poisson distribution models the occurrence of events over a fixed interval and is particularly effective for describing rare or random events. In assignments, students are often asked to explain the assumptions behind these models and justify their applicability to specific situations.
Continuous Probability Distributions
Continuous distributions describe variables that vary over a continuum. The uniform distribution assumes equal likelihood across a range and serves as a theoretical baseline for comparison. The exponential distribution models waiting times between events and is notable for its lack of memory, a property often emphasized in theoretical discussions.
The normal distribution holds special importance due to its symmetry and natural occurrence in many phenomena. Mathematics assignments frequently explore its theoretical role in approximation, error analysis, and probabilistic reasoning rather than focusing solely on computation.
Stochastic Processes and Numerical Approximation Methods
Beyond individual probability models, mathematics assignments often address systems that evolve over time and methods that approximate unknown values. Stochastic processes describe time-dependent randomness, while numerical methods provide structured approximation techniques. This section connects these two areas within a theoretical framework.
Poisson Processes and Renewal Theory
A homogeneous Poisson process models random events occurring at a constant average rate, making it a foundational concept in stochastic modeling. Nonhomogeneous Poisson processes extend this idea by allowing the rate of occurrence to change over time, reflecting more realistic conditions.
Renewal processes further generalize event-based modeling by focusing on the time between successive occurrences. These models are used to study long-term behavior in systems that reset after each event. In assignments, students are expected to understand assumptions, interpret outcomes, and analyze stability rather than perform exhaustive calculations.
Newton’s Divided Difference Interpolation Formula
Numerical methods become essential when exact analytical solutions are difficult to obtain. Newton’s divided difference interpolation formula provides a systematic approach to constructing an approximating polynomial using a given set of data values.
The interpolation polynomial is expressed in a stepwise form, where each term builds upon previously computed divided differences.
In general, the interpolation polynomial can be written as:
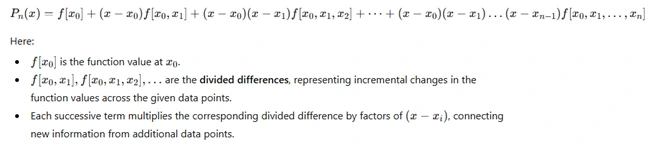
The theoretical value of this method lies in its logical structure and flexibility. Mathematics assignments often emphasize understanding the form of the interpolation expression and the role of divided differences, rather than detailed computation. This approach highlights how interpolation connects discrete data values with continuous functions, reinforcing the importance of approximation techniques in applied mathematical analysis.
Conclusion
Statistics and numerical methods together form a cohesive framework for analyzing data, modeling uncertainty, and approximating mathematical relationships in mathematics assignments. From data classification and descriptive measures to probability distributions and stochastic processes, each topic builds upon foundational theoretical ideas. Numerical interpolation further supports these concepts by offering reliable approximation strategies grounded in mathematical logic.
For students seeking mathematics assignment help, a strong theoretical understanding of these topics is essential. Emphasizing interpretation, assumptions, and structure enables clearer reasoning, stronger explanations, and more effective academic performance across statistical and numerical assignments.